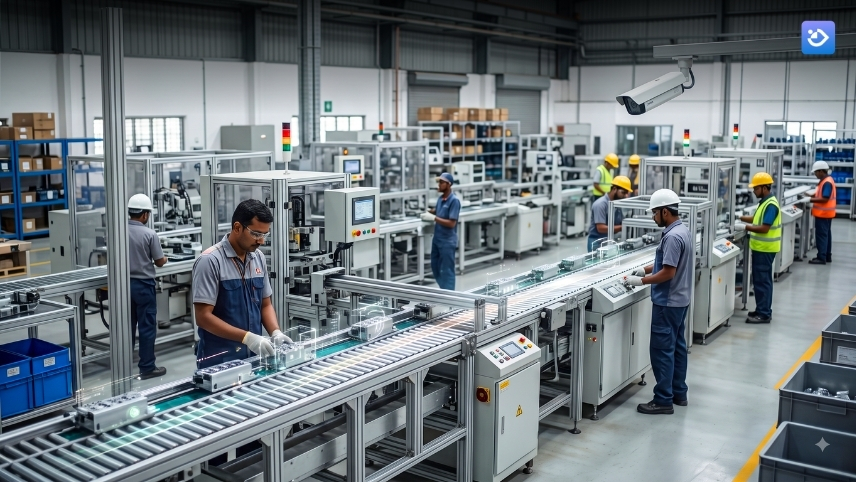
The ₹28.8 Lakh a Year Your OEE Dashboard Never Shows You
Your OEE (Overall Equipment Effectiveness) dashboard says 62%, the shift supervisor says the line ran normally, while the maintenance log records only one 40-minute stoppage. Three sources, three different stories, and you're the one who has to explain the gap to the plant head on Monday morning.
So which one is lying? Probably none of them, at least not on purpose. Most teams jump straight to blaming the equipment, an aging line, an operator who had a slow week. Equipment failure is only one source of production loss. The harder problem is identifying the smaller losses that happen between recorded stoppages. The number is usually wrong because the data feeding it was collected by hand, logged hours after the fact, and never designed to catch what happens in the gaps between the events someone actually wrote down.
This is why computer vision manufacturing deployments feel like a different conversation from yet another maintenance dashboard. A camera doesn't get tired of logging a five-minute jam at 2 a.m. It doesn't round a slow cycle up to make a shift look better on paper. It just watches continuously, and reports what actually happened.
The Losses Your Spreadsheet Never Sees
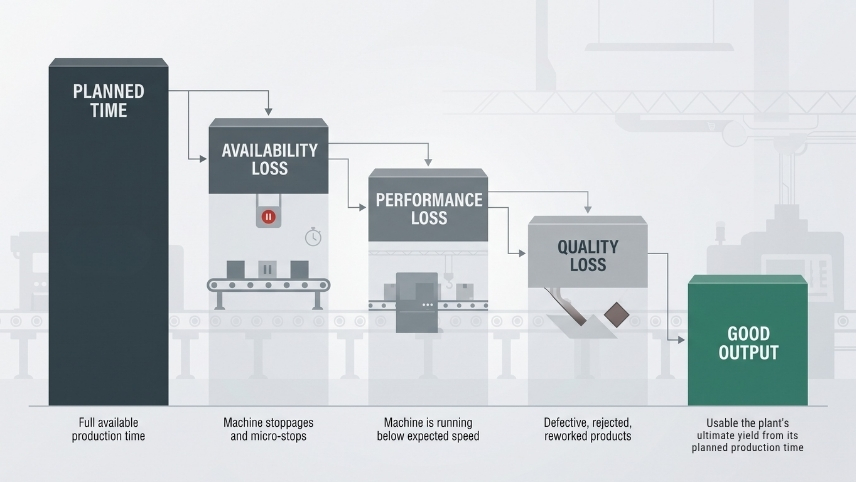
Ask anyone what OEE means and they'll rattle off the formula in seconds: availability times performance times quality. Ask them how each of those three numbers actually gets measured on their floor, and the answer usually gets shakier. Availability often comes from PLC pulses that only catch a full stop. Performance is scribbled onto a tally sheet somewhere near the end of a shift. Quality gets checked after the part has already travelled past two or three more stations.
Whatever falls between those checkpoints just doesn't get counted.
- Take a jam that clears itself in under two minutes. Nobody stops the line to write that down; there's no time, but stack up ten of those in a single shift and the lost hours are real, even if the log never mentions them.
- Speed loss hides in plain sight. A line running below its rated cycle time doesn't trip a fault code, so the PLC happily reports "running" while output quietly bleeds away.
- Changeover drift gets logged as one lump number, so there's no way to tell how much of that window was genuinely necessary and how much was a missing tool or an operator waiting on instructions.
- Unplanned operator waiting or material movement delays can also disappear from conventional production logs when they don't trigger a machine fault.
None of this is anyone's fault, really. It's a visibility problem, not a people problem.
Deloitte estimates that unplanned downtime costs industrial manufacturers around $50 billion annually.
For individual plants, however, the problem isn't always a dramatic equipment failure. Smaller, repeated losses can also accumulate, and those are often harder to measure consistently.
The Cameras Are Already There. Start Using Them
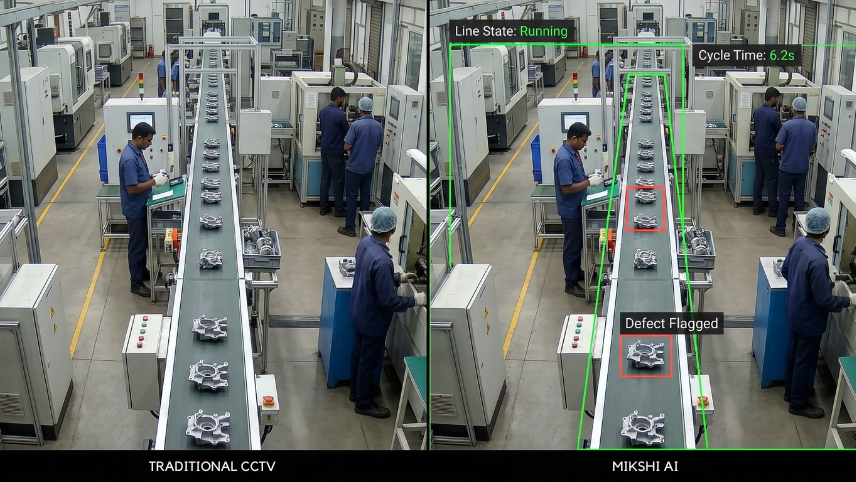
Here's the part most plants haven't connected yet: they already have CCTV running on the floor for safety and security. Computer vision manufacturing software takes that same feed and turns it into a live stream of availability and performance data; no new PLC wiring, no machine retrofit, no new hardware to install.
What it actually watches for:
- Line state, second by second, distinguishing running, idle, and stopped without an operator having to press a button to log it.
- Cycle time, comparing each part's actual timing against the standard, and flagging drift before it becomes a habit.
- Changeovers, timed from the exact moment they start to the exact moment they end, so the number on paper finally matches what happened.
- Micro-stops, logged the moment the line dips out of a running state, so a ninety-second jam gets counted instead of disappearing between shift reports.
An OEE number calculated once a shift is a snapshot. An OEE number that updates while the line is still running is something closer to a pulse.
Still relying on end-of-shift paperwork to explain why yesterday's OEE dropped eight points?
Try Mikshi AI for FREEWhat Twelve Minutes a Shift Is Actually Worth
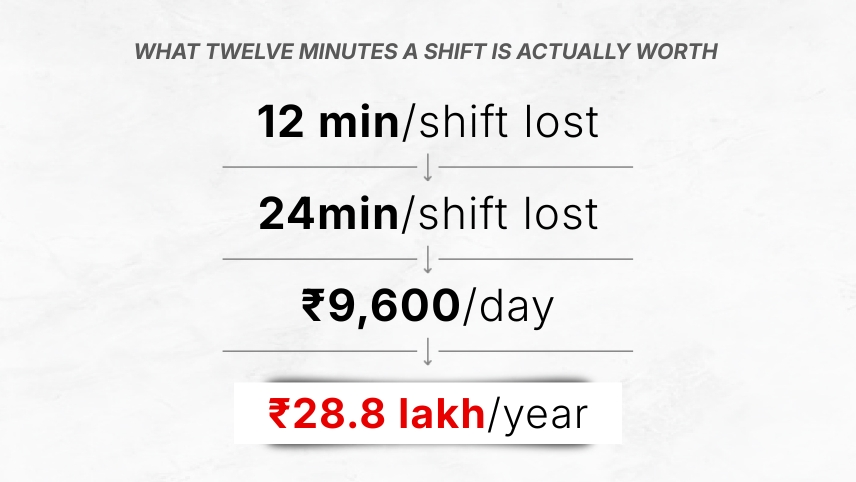
Take a mid-sized line, two shifts, sixteen hours a day, making a component worth a conservative ₹40 a unit at a six-second cycle time. Now say that line loses twelve minutes a shift to micro-stops nobody bothers logging. That's 24 minutes a day, about 240 units gone.
Run the math: ₹40 a unit, roughly ₹9,600 a day, and across 300 production days a year, one line quietly bleeds close to ₹28.8 lakh. Most plants aren't running just one line.
This isn't a precise forecast of your plant, and it doesn't need to be. It's the arithmetic most OEE reports never bother running, because the underlying losses never made it into the log to begin with.
Where This Fits Alongside Your Existing Quality Process
It's worth being upfront about scope here. Computer vision manufacturing software built to run on standard CCTV feeds is strong at watching line state, cycle time, and changeovers, the availability and performance side of OEE. Catching manufacturing defects reliably enough to replace a trained inspector or an inline QC system is a different, harder problem, and it isn't what this kind of camera setup is built to do. Quality inspection stays with whatever process you're already running, manual checks, sampling, or a dedicated inspection system.
That's not a small caveat, but it's not a limitation on the availability and performance gains either. McKinsey has found that predictive maintenance typically cuts machine downtime by 30 to 50 percent and extends machine life by 20 to 40 percent, and that kind of gain starts with exactly the data camera-based software produces: accurate, continuous cycle time and stoppage records, not the estimates a shift-end log gives you.
There's a practical upside to keeping these separate, too. Once your availability and performance numbers are finally accurate, it's much easier to tell whether a quality dip on your existing inspection reports is a process problem or just noise from an OEE score that was never measuring the right thing to begin with.
Getting This Onto the Floor Without Stopping It
Plants that see the fastest return treat this as a data rollout first, an equipment project a distant second.
- Pick one or two bottleneck lines to start, not the whole plant. Smaller scope, clearer results, easier to defend to leadership.
- Lean on the CCTV you already have wherever placement and resolution allow it. New hardware only where the old one genuinely can't do the job.
- Route the output into the OEE or MES dashboard your team already checks, so nobody's learning a second system.
- Record a baseline OEE with your current manual method before switching over. You want a documented before-and-after, not an assumed one.
Handled this way, there's no shutdown, no capital-heavy retrofit, and operators keep working the line the way they always have. What changes is what gets measured, not how the line runs.
How Mikshi AI Closes the OEE Measurement Gap
Your plant already produces an OEE number every shift. Whether that number means anything depends on who had time to write what, and how much slipped through while they were busy doing something else. Somewhere in that gap sits a fair slice of the $50 billion in unplanned downtime the industry loses every year.
What Mikshi AI does is fairly simple to describe: it's AI video analytics software that points at cameras your plant is probably already running for security, and turns that footage into availability and performance numbers, without a PLC integration project and without shutting the line down to deploy it.
In practice, that looks like this. Micro-stops and speed loss show up the same day they happen instead of surfacing three months later in a quarterly review. Changeover timing gets logged automatically, start to finish, so the number on paper finally matches what happened on the floor. The numbers land inside the OEE or MES dashboard your team already checks, so there's no separate screen to learn. And most plants start small, one bottleneck line or two, before deciding whether the results justify rolling it out further.
Computer vision doesn't replace your existing OEE process, or your existing quality process. It fixes the part that was always broken: giving your plant a continuous, honest account of what your equipment is actually doing all day.
Ready to see your actual availability and performance numbers?
Try Mikshi AI for FREEIn this article
- The ₹28.8 Lakh a Year Your OEE Dashboard Never Shows You
- The Losses Your Spreadsheet Never Sees
- The Cameras Are Already There. Start Using Them
- What Twelve Minutes a Shift Is Actually Worth
- Where This Fits Alongside Your Existing Quality Process
- Getting This Onto the Floor Without Stopping It
- How Mikshi AI Closes the OEE Measurement Gap


